
DC removal
What problem are you trying to solve?
The problem we aim to solve is real-time pitch detection accurately and simply. Pitch refers to how high or low a sound is perceived by the human ear. The fundamental frequency of the human voice is determined by the periodic movement of the vocal cords, which also determines the pitch.
How does the code you wrote solve the problem?
There are three main methods for detecting the resonant frequency: in the time domain, in the frequency domain, and in the cepstrum domain. The main advantage of the time domain method is its relatively fast computation time, which allows for real-time application. We used an algorithm called Autocorrelation in Time Domain (ACF time) with our enhancements to improve accuracy. Here’s an explanation of autocorrelation:
In our case, we want to find the pitch of the signal, but this frequency usually comes with noise that interferes with detection. Let's examine the autocorrelation formula used:
Where:
- ACFtime (τ): The value of the autocorrelation function for a delay of τ.
- wav: The received signal.
- N: The number of samples.
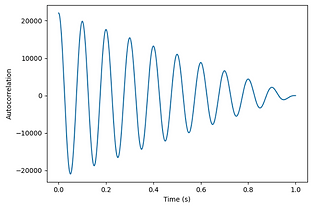
Note that if there is a periodic signal in time that is dominant (our resonant frequency), then if we shift the wav by time τ, the autocorrelation will reach a local maximum. Indeed, for autocorrelation of a sinusoidal signal with a frequency of 10Hz, τ=0.1s:
It can be seen that the first maximum point is indeed after 0.1 seconds as expected. (There is also a maximum at t=0, but this is because the signal is multiplied by itself with no shift, so we do not consider this.)
We will use this property of autocorrelation to find the resonant frequency for each specific number of samples.
Explanation of the code:
- Part One - Preprocessing:
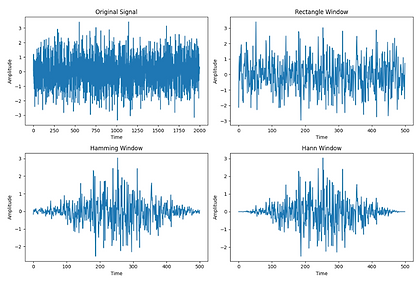
- Hanning Window: Unlike a regular window, the Hanning window looks like this:
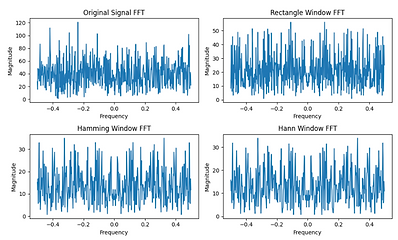
This window smooths the frequencies at the edges. For comparison:
In the Time Domain:
In the Frequency Domain:**
- Mean Removal: Helps remove low frequencies (close to DC).
- Part Two - Autocorrelation:
We performed autocorrelation as follows:
- Part Three - Analysis and Filtering of Autocorrelation:
- After we have the signal post-autocorrelation and normalization, we remove values that are below one-tenth of the maximum value of the graph and set them to zero. Then, we look for the first slope, and from there, we search for the peak. The search itself is limited to an array of size Max Period - Min Period to narrow down the search area.
- Parabolic Interpolation: After finding the peak, we want to refine its position, i.e., perform interpolation to find the true peak in the vicinity of the found extremum. Since regular interpolation is resource-intensive, we used parabolic interpolation that uses values to the left and right of the extremum to find a more accurate peak.
When calculating the frequency, we need to consider the sampling frequency fs and the period (which is the number of samples until we reach the peak). Therefore, we calculate the pitch in the code as follows:
We also added conditions to restrict the pitch to reasonable values, defined to be between 50Hz and 800Hz.
Additionally, in the loop that divides the signal into segments processed to find the pitch, we ensured there is overlap between the segments.
The idea of the Hanning window and parabolic interpolation was taken from the paper "Improving Monophonic Pitch Detection Using the ACF and Simple Heuristics" by Carlos de Obaldía and Udo Zölzer.
What challenges required you to use existing modules and what do the modules do?
The challenges we faced were:
1. Finding a method that is both fast and efficient on one hand, and accurate on the other.
2. Ensuring the code works in real time (causal).
3. Preventing high frequencies from interfering with autocorrelation - we used the Hanning window to smooth the signal edges.
4. Obtaining an accurate peak despite using multiplication with the windowed signal (to take part of the signal) and discrete sampling. We used parabolic interpolation to find a more accurate peak and eliminated local peaks that were too small.
What types of inputs does the code accept and what should we expect in the output?
- Input: A wave file.
- Output: An array containing the pitch for each sample file in the signal (with overlap).
Variable Names and Their Descriptions:
- chunk: The number of samples we take from a small part of the signal. Used to divide the signal into smaller sections for real-time processing.
- min_pitch: The minimum pitch frequency in Hertz (Hz). Defines the lower limit for pitch detection to ensure that the pitch output is within a reasonable range for human speech.
- max_pitch: The maximum pitch frequency in Hertz (Hz). Defines the upper limit for pitch detection to ensure that the pitch output is within a reasonable range for human speech.
- frame: A segment of the signal. The part of the signal processed to find the pitch in real time.
- fs: The sampling rate of the signal. Used to calculate the minimum and maximum period and subsequently the pitch.
- min_period: Minimum period time. Used to limit the search for pitch within the autocorrelation function.
- max_period: Maximum period time. Used to limit the search for pitch within the autocorrelation function.
- windowed_frame: The frame of the signal after applying the Hamming window. Provides a signal with smooth edges, important for autocorrelation.
- corr: The array of results from the autocorrelation operation performed on the frame. Used to find the fundamental period of the signal.
- d: An array containing the differences between every two consecutive values in the corr array. Used to find the first positive difference.
- start: The first index in the corr array where there is a positive difference between consecutive values. Helps in calculating the first peak in the corr array.
- PositiveSlope: An array of indices where there is a positive slope. Helps find the first point with a positive slope to search for the peak from that point onward.
- peak: The first peak in the corr array. A crucial part of pitch calculation.
- alpha: The value in the corr array at the index before the peak. Used for parabolic interpolation of the peak.
- beta: The value in the corr array at the index after the peak. Used for parabolic interpolation of the peak.
- gamma: The value in the corr array at the peak. Used for parabolic interpolation of the peak.
- p: The result of the parabolic interpolation algorithm for the peak. Used to calculate the accurate peak.
- pitch_period: The fundamental period of the signal. An essential part of pitch calculation.
- pitch: The pitch of the signal. The output of the code, representing the computed pitch.
- wf: The opened wave file.
- num_channels: The number of channels in the wave file. Important to know if there is more than one frequency.
- sampwidth: The sample width (in bits). Indicates the number of bytes used to represent each audio sample.
- framerate: The sample rate. Number of samples per second (Hz).
- num_frames: The total number of frames we need to process. Indicates how many times we need to perform the pitch detection calculation.
- audio_data: Contains all the samples from the wave file.
- pitches: A list to store pitch values found for each frame in the signal. Important to return all found pitch values if requested.
Section Title
Section Subtitle
Every website has a story, and your visitors want to hear yours. This space is a great opportunity to give a full background on who you are, what your team does and what your site has to offer. Double click on the text box to start editing your content and make sure to add all the relevant details you want site visitors to know.
If you’re a business, talk about how you started and share your professional journey. Explain your core values, your commitment to customers and how you stand out from the crowd. Add a photo, gallery or video for even more engagement.